Penny has been commissioned to paint a large mural on the side of the humane society. The society has a mascot, an African lion that the society supports by donating money to the local zoo for his care. Penny is expected to sketch the lion, submit the sketch to the board of the humane society for approval, and then scale up the drawing to 22 square feet so it will cover the side of the building. Shortly after Penny actually begins the job of painting the mural, she is visited by the chairman of the board of the humane society. He tells Penny that the Fire Chief has just notified the society that the additional activity the mural is expected to attract means that the building will need another entrance/exit for fire safety. Unfortunately, that means that the mural will need to be moved up and to the right about 5 feet. What kinds of transformations of complex lines (like the ones in this lesson) will Penny have used by the time she completes the job?
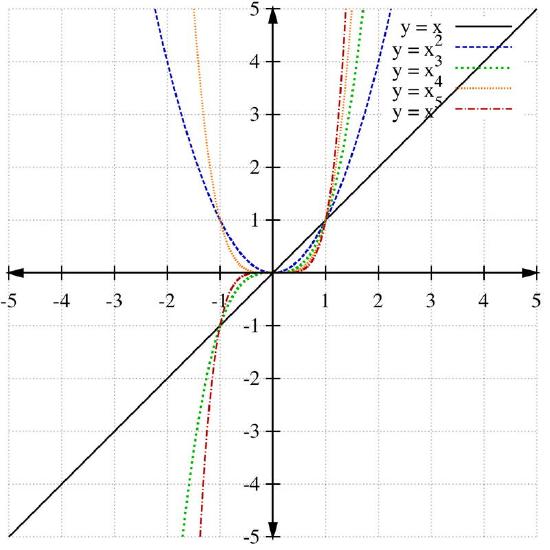
You have already studied many different kinds of functions, for example linear functions, constant functions, and quadratic functions. All three these functions belong to a larger group of functions called the polynomial functions. The most simple polynomial is called a power function. A power function is a polynomial of the form f(x)=ax n where a is a real number and n is an integer with n≥1. If n is even, then the power function is also called “even,” and if n is odd, then the power function is “odd.” The graphs of the first five power functions are shown below. Notice that each power function has only one x− and y−intercept, the origin (0, 0). The end behavior of a function describes the y−values as x gets very large (x→∞ in symbols) or as x gets very small (x→−∞).
As with quadratics and polynomials, the leading coefficient a changes the vertical “stretching” of power functions.
Just like quadratics, polynomial functions can be graphed using transformations of a known graph. The basic transformations are vertical and horizontal shifts and reflections about the x− and y−axis.
Given a polynomial p(x) and constant real numbers c and a
Earlier, you were asked a question about the kinds of transformations of complex lines that Penny will have used in her sketch by the time she completes it.
Solution
When Penny first sketches the lion, she will be (probably unconsciously) applying a vertical and horizontal compression to the sketch, unless she is using a very large piece of paper!
Once the sketch is approved, Penny will then need to greatly stretch the image vertically and horizontally to make the image big enough to cover the side of the building.
After the Fire Chief visit, Penny was required to apply a horizontal and vertical shift to move the image out of the way of the new door.
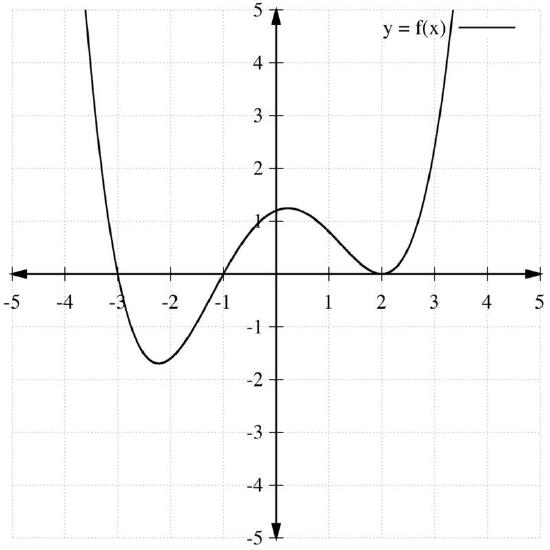
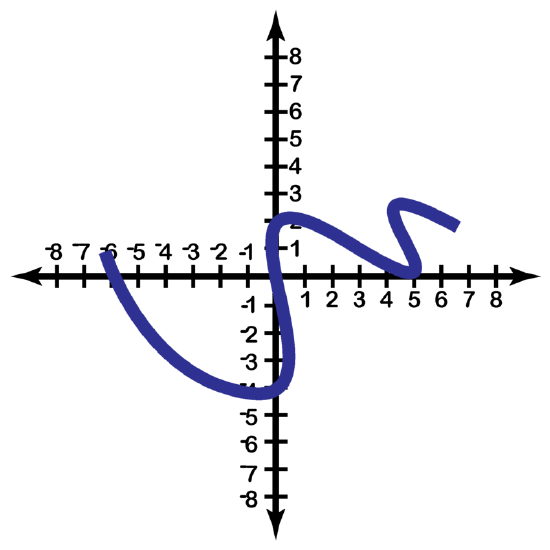
The graph of f(x) is shown below. Use the graph of f(x) to graph f(x+4).
Solution
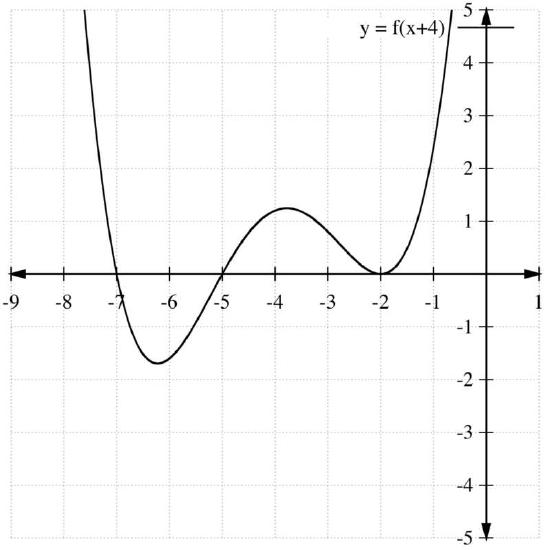
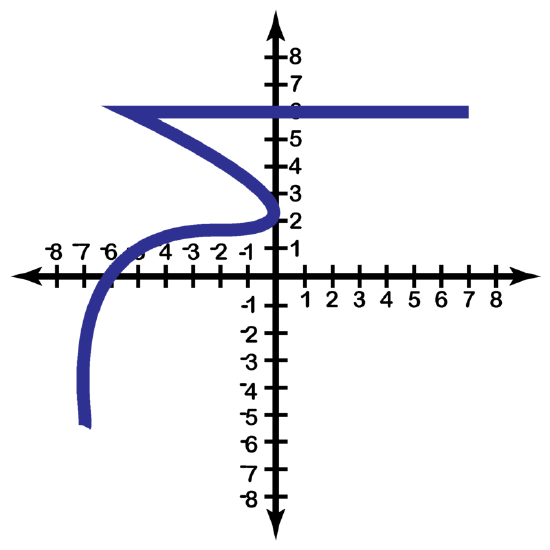
This is a horizontal shift of f(x) to the left by 4 units.
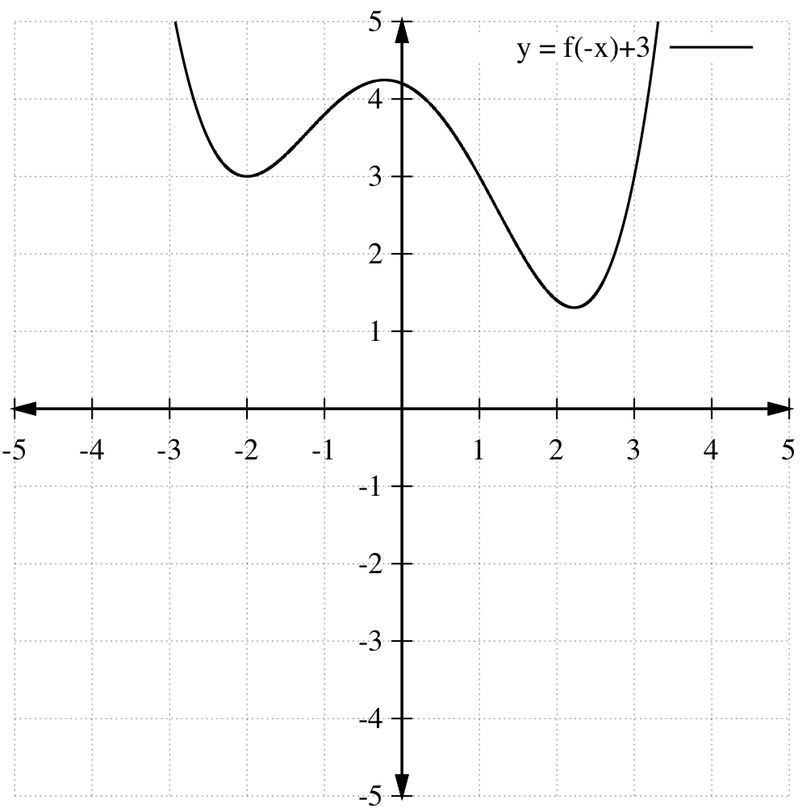
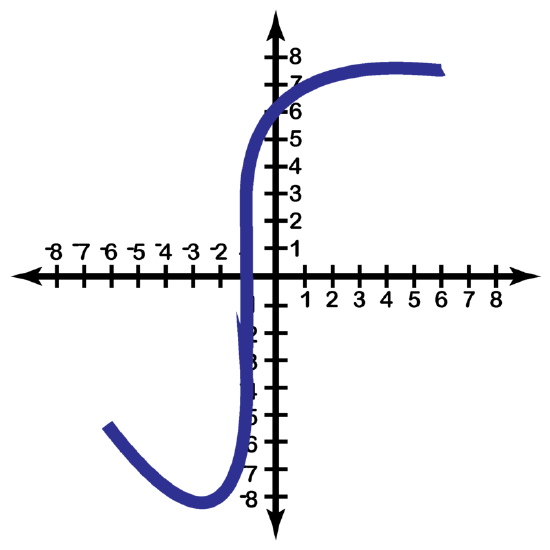
The graph of f(x) is shown below. Use the graph of f(x) to graph f(−x)+3.
Solution
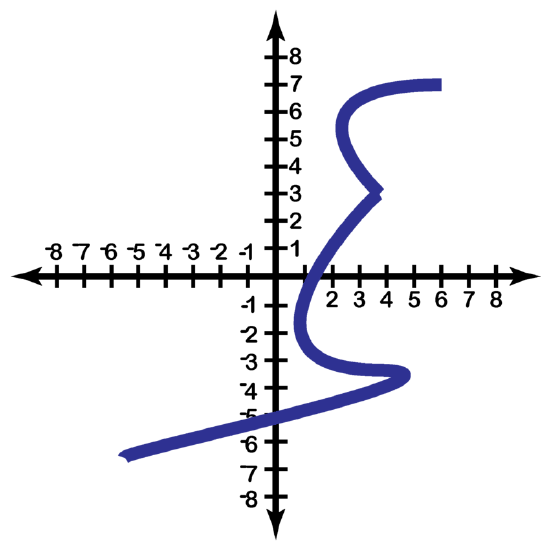
This is a reflection of f(x) about the y−axis and a vertical shift up by 3 units.
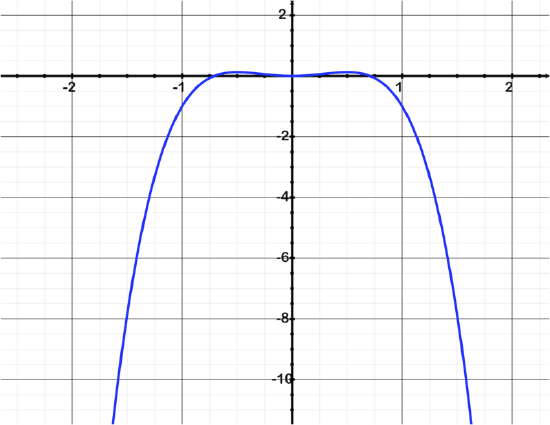
Describe the transformations to a graph of the function y=x 2 necessary to make a reasonable approximation of f(x)=−x 4 .
Solution
Since f(x)=−x 4 is an even function, the function f(x)=−x 2 is a reasonable approximation, requiring only a reflection of y=x 2 across the x-axis.
Describe the transformations necessary to make a graph of the reference function f(x)=x 3 look like the graph of y=−2x 3 +2.
Solution
The transformations required to replicate the function y=−2x 3 +2 are reflect f(x)=x3 across the x-axis, stretch f(x)=−x 3 by 2, and shift f(x)=−2x 3 upward by 2.
Describe the end behavior of f(x)=−7x 3 +6x 2 −3x using the leading coefficient test.
Solution
According to the leading coefficient test, given f(x)=ax n where a is the leading coefficient and n is the degree, if n is odd and a is negative, the graph goes up on the left, and down on the right.
∴f(x)=−7x 3 +6x 2 −3x grows without bound toward ∞ in Quadrant II and grows negatively without bound in Quadrant IV.
Describe the transformation given in each question below:
Graph the following by using transformations of parent functions:
Describe each transformation based on the images below:
 To
To 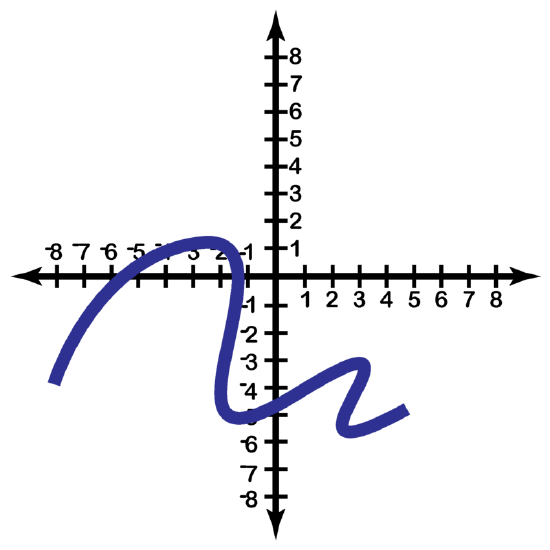
 To
To 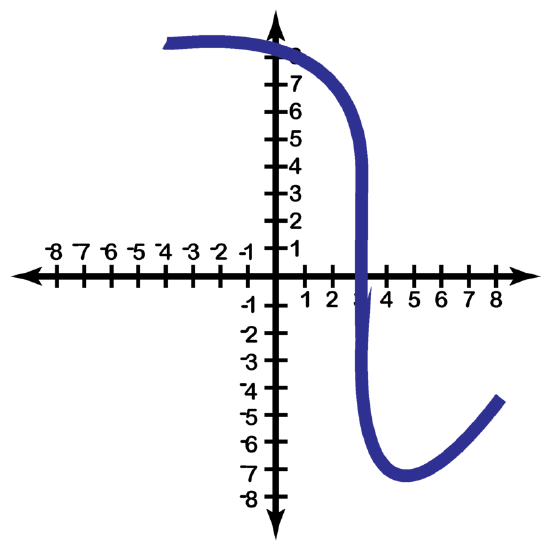
 To
To 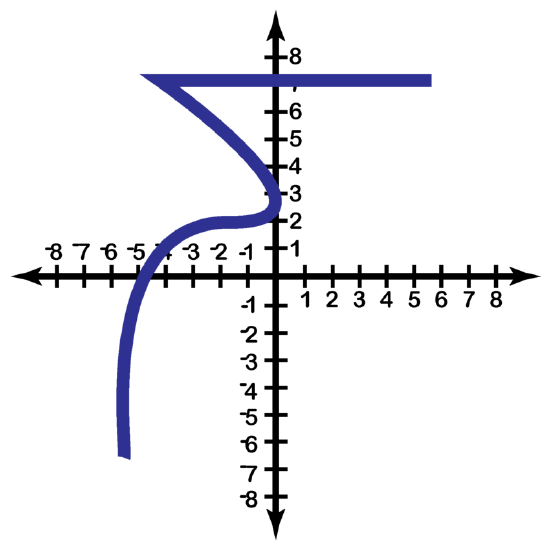
 To
To 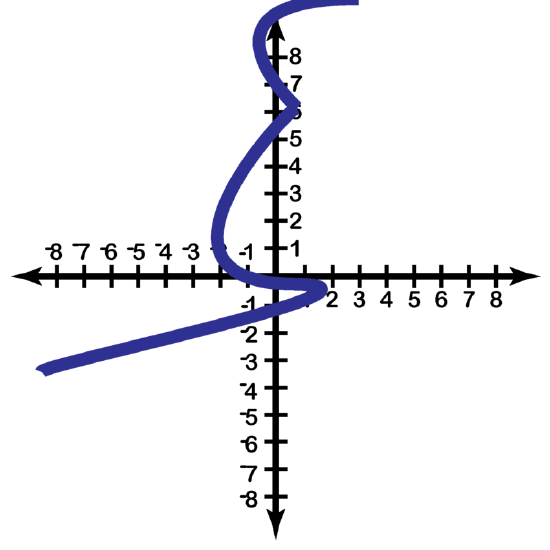
To see the Review answers, open this PDF file and look for section 2.3.
| Term | Definition |
|---|---|
| compression | A stretch or compression is a function transformation that makes a graph narrower or wider, without translating it horizontally or vertically. |
| Odd Power Function | An odd power function is a polynomial of the form f(x)=ax n where a is a real number and n is an odd integer. |
| parent function | A parent function is the simplest form of a particular type of function. All other functions of this type are usually compared to the parent function. |
| Polynomial | A polynomial is an expression with at least one algebraic term, but which does not indicate division by a variable or contain variables with fractional exponents. |
| Polynomial Graph | A polynomial graph is the graph of a polynomial function. The term is most commonly used for polynomial functions with a degree of at least three. |
| Power function | A power function is a polynomial of the form f(x)=ax n where a is a real number and n is an integer with n≥1. |
| Reflection | Reflections are transformations that result in a "mirror image" of a parent function. They are caused by differing signs between parent and child functions. |
| shift | A shift, also known as a translation or a slide, is a transformation applied to the graph of a function that does not change the shape or orientation of the graph, only the location of the graph. |
| shifts | A shift, also known as a translation or a slide, is a transformation applied to the graph of a function that does not change the shape or orientation of the graph, only the location of the graph. |
| stretch | A stretch or compression is a function transformation that makes a graph narrower or wider. |
| stretching | Stretching a graph means to make the graph narrower or wider. |
| Transformations | Transformations are used to change the graph of a parent function into the graph of a more complex function. |
This page titled 2.2.1: Graphs of Polynomials Using Transformations is shared under a CK-12 license and was authored, remixed, and/or curated by CK-12 Foundation via source content that was edited to the style and standards of the LibreTexts platform.